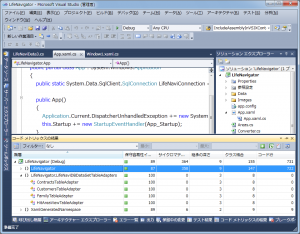
前回は、Visual Studio Code Metrics PowerTool 10.0 が提供する5つのコードメトリックス値について説明をしました。
今回は、個々のメトリックス値がどのように変化していくのか、をテーマに 保守容易性指数 について説明します。
Explanation
おさらいですが、保守容易性指数はMSDNのコード メトリックス値というページでの説明によると、
保守容易性指数 – コードの相対的な保守容易性を表す、0 ~ 100 のインデックス値を算出します。
値が大きいほど、保守容易性が優れていることを示します。
色分けしたコード評価を使用して、コード内の問題部分をすばやく識別することができます。
緑色の評価は 20 ~ 100 の範囲にあることを示し、コードの保守容易性が良好であることを示します。
黄色の評価は 10 ~ 19 の範囲にあることを示し、コードの保守容易性が中程度であることを示します。
赤の評価は 0 ~ 9 の範囲にあることを示し、保守容易性が低いことを示します。
と定義されています。
上述の緑、黄、赤というのは、下記の画像(http://www.microsoft.com/japan/msdn/vstudio/2010/overview/about3.aspxより拝借しております。不味かったら消します。)中の 保守容易性イ… という列の四角いアイコンを指します。実に直感的です。
ところで、保守容易性指数はどういう風に算出されているのでしょうか? …ありました。探せばあるものです。
Code Analysis Team Blog
にて記述されていますが、
Maintainability Index = MAX(0,(171 - 5.2 * ln(Halstead Volume) - 0.23 * (Cyclomatic Complexity) - 16.2 * ln(Lines of Code))*100 / 171)
という数式から算出されているそうです。
つまり、保守容易性指数は、サイクロマティック複雑度とコード行とHalstead Volumeなる指標に基づいた値のようです。
しかし、ここで突然Halstead Volumeなる値が出てきましたが、これはなんでしょうか? Wikipediaで苦労して見つけましたが、
Halstead complexity measures Halstead complexity measures are software metrics introduced by Maurice Howard Halstead in 1977[1] as part of his treatise on establishing an empirical science of software development. Halstead makes the observation that metrics of the software should reflect the implementation or expression of algorithms in different languages, but be independent of their execution on a specific platform. These metrics are therefore computed statically from the code. Halstead’s goal was to identify measurable properties of software, and the relations between them. This is similar to the identification of measurable properties of matter (like the volume, mass, and pressure of a gas) and the relationships between them (such as the gas equation). Thus his metrics are actually not just complexity metrics. == Calculation == For a given problem, Let: First we need to compute the following numbers, given the program: $$\eta_1$$ = the number of distinct operators $$\eta_2$$ = the number of distinct operands $$N_1$$ = the total number of operators $$N_2$$ = the total number of operands From these numbers, several measures can be calculated: Program vocabulary: $$\eta = \eta_1 + \eta_2$$ Program length: $$N = N_1 + N_2$$ Calculated program length: $$\hat{N} = \eta_1 \log_2 \eta_1 + \eta_2 \log_2 \eta_2$$ Volume: $$V = N \times \log_2 \eta$$ Difficulty : $$D = { \eta_1 \over 2 } \times { N_2 \over \eta_2 }$$ Effort: $$E = D \times V$$
の、Volumeがそれに該当するようです(可読性向上のため、数式をLatexで変換して引用しました)。
けれど、これではまだよくわかりません。
そこで簡単ではありますが、保守容易性指数が変化する様子をソースコードを用いて観察してみましょう。
Exercise
前々回で用意したサンプルのソースを下記のように改造しました。
1 | namespace CodeMetricsTest |
現実的には、絶対にあり得ないコードですが、これを Metrics.exe で計測してみましょう。
その結果が下記になります。
| メトリックス項目 | CodeMetricsTest.exe | CodeMetricsTest | Program | Main(string[]) : void | Program() |
|---|---|---|---|---|---|
| MaintainabilityIndex (保守容易性指数) |
23 | 23 | 23 | 15 | 100 |
| CyclomaticComplexity (サイクロマティック複雑度) |
2 | 2 | 2 | 1 | 1 |
| ClassCoupling (クラス結合度) |
0 | 0 | 0 | 0 | 0 |
| DepthOfInheritance (継承の深さ) |
1 | 1 | 1 | - | - |
| LinesOfCode (コード行) |
502 | 502 | 502 | 501 | 1 |
サイクロマティック複雑度が変化していなくても、ただコード行が増えるだけで、保守容易性指数 が低下しているのがわかります。
Conclusion
まとめると、保守容易性指数は、
- 制御フローの数から算出されるコードの構造上の複雑さを表すサイクロマティック複雑度
- ILコードに基づいたコードの行数であるコード行
- ソースコード中の演算子と非演算子の種類数、出現回数の総和から算出されるHalstead Volume
の3つのメトリックス値に基づいていることがわかりました。
つまり、ソースコードの行数が長くなると、分岐が増えなくても、比例して演算子と非演算子の出現数が増えるから保守容易性指数も下がる(ソースコードはコンパクトに!!)という訳ですね。
長くなりましたが、コード行の長さが保守の用意さに結びついている(数値的な意味で)のがわかりました。
というわけで次回は サイクロマティック複雑度 について、ソースコードを交えながら説明します。

